

Appearance
XYZ Chart
XYZ Chart aggregates a Z value (metric) against combinations of X value and Y value (both dimensions) and displays the result. The difference from XY Chart is that the Y side is also a dimension.
Drawing types
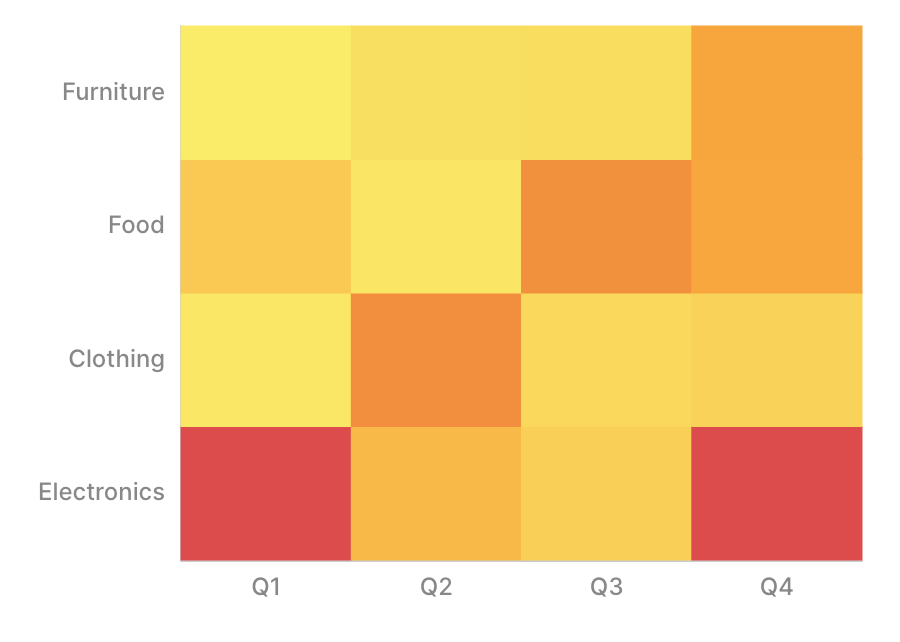
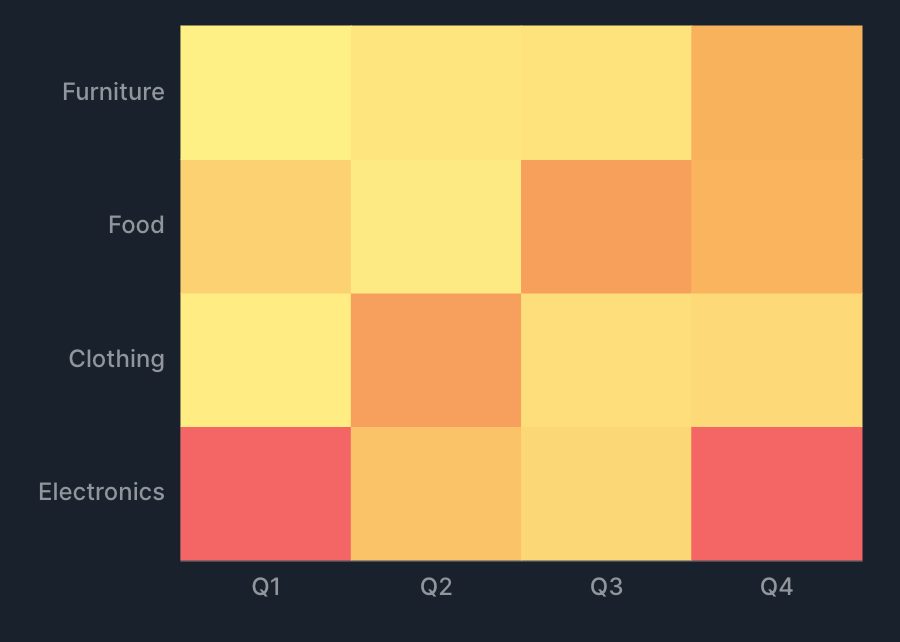
XYZ Chart supports the following drawing types.
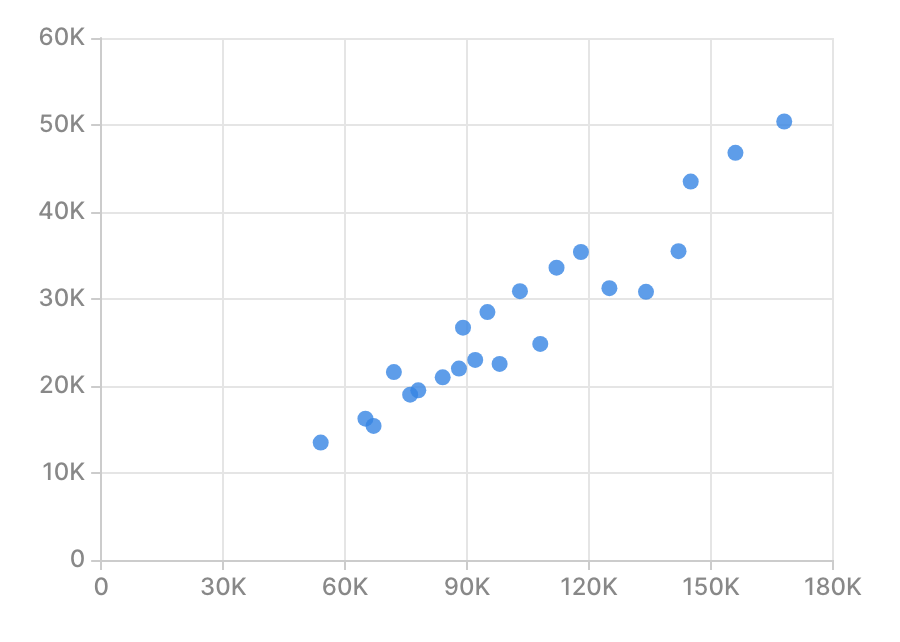
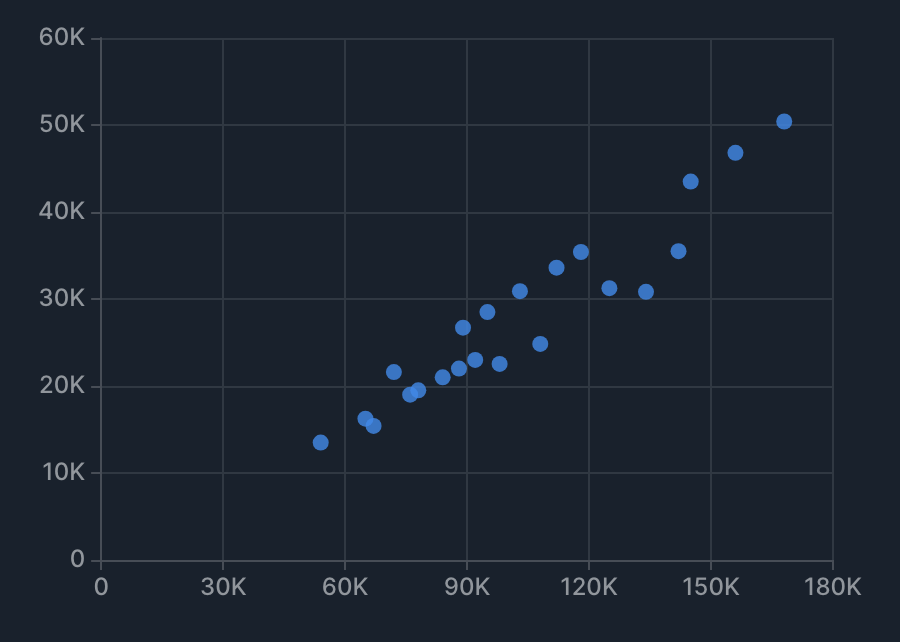
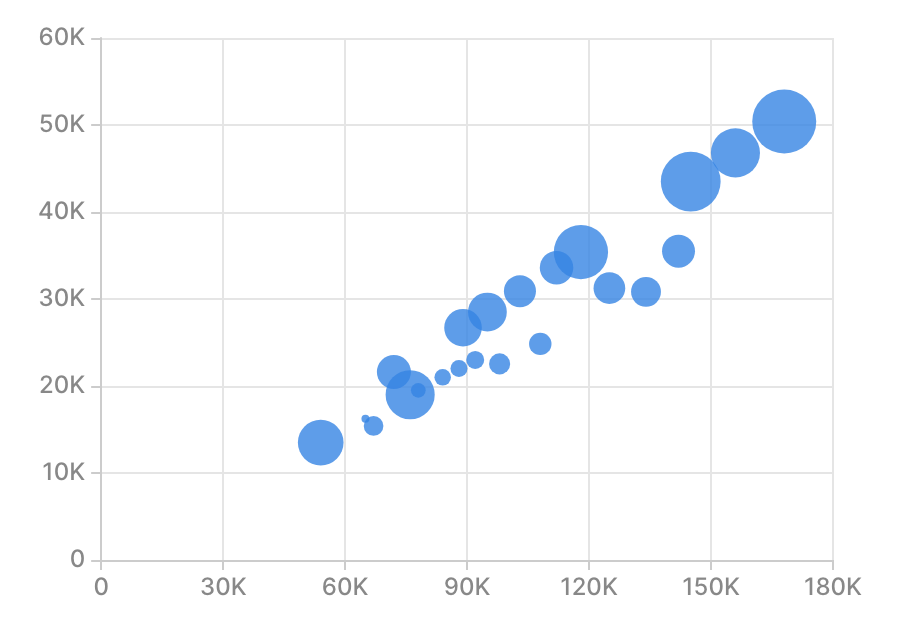
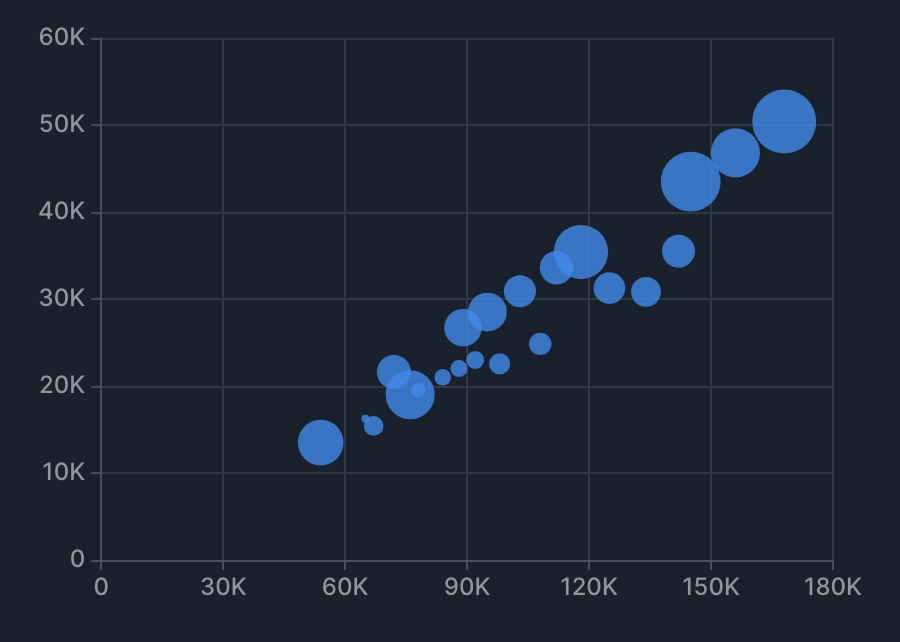
Specification
Aggregation
XYZ Chart treats X value and Y value as dimensions and Z value as a metric, aggregating Z for each combination of X and Y. See Dimensions and metrics for the concepts behind dimensions and metrics.
| Item | Role | Notes |
|---|---|---|
| X value | Dimension | Becomes the X axis. |
| Y value | Dimension | Becomes the Y axis. |
| Z value | Metric | Specified for bubble and heatmap. |
| Group by | Dimension | Scatter and bubble only (splits the series). |
Examples
- Show "total sales by product category × region" as a heatmap.
- X value: product category.
- Y value: region.
- Z value: sum of sales.
- Show "the relationship between ad spend and sales" as a bubble chart.
- X value: ad spend.
- Y value: sales.
- Z value: profit.
X-axis specification
In XYZ Chart, how the X and Y axes are treated depends on the drawing type.
- For heatmap, both the X and Y axes are category axes.
- For scatter and bubble, the X axis is a category, time, or numeric axis depending on the data type, and the Y axis is a numeric axis.
For the behavior of each axis (display rules for category, time, and numeric axes), see X-axis specification for XY Chart.
Tips
Axis range
For scatter and bubble, the range of a numeric axis includes 0 by default. If you turn on advanced settings > X axis / Y axis > Unpin axis from zero, that axis is drawn with a range that fits the data without including 0.
Frame
XYZ Chart supports the frame feature. See Frame for details.
Reference lines, trends, and statistics
See Reference lines, trends, and statistics for details.