

Appearance
Table Chart
Table Chart displays data as a table. The source type lets you choose between a raw table that shows fetched rows as-is, and an aggregated table that groups and aggregates data.
Drawing types
Table Chart supports the following drawing types.
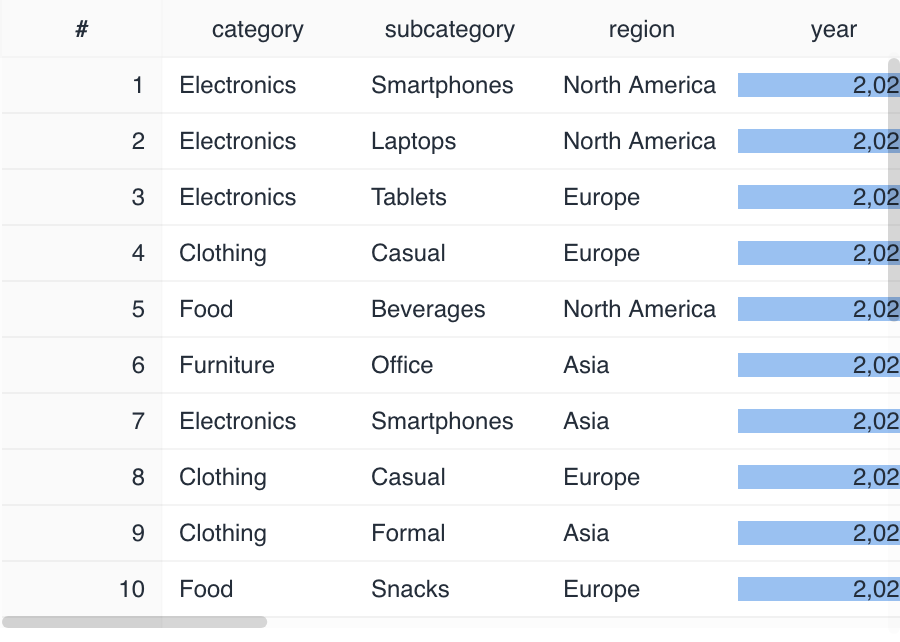
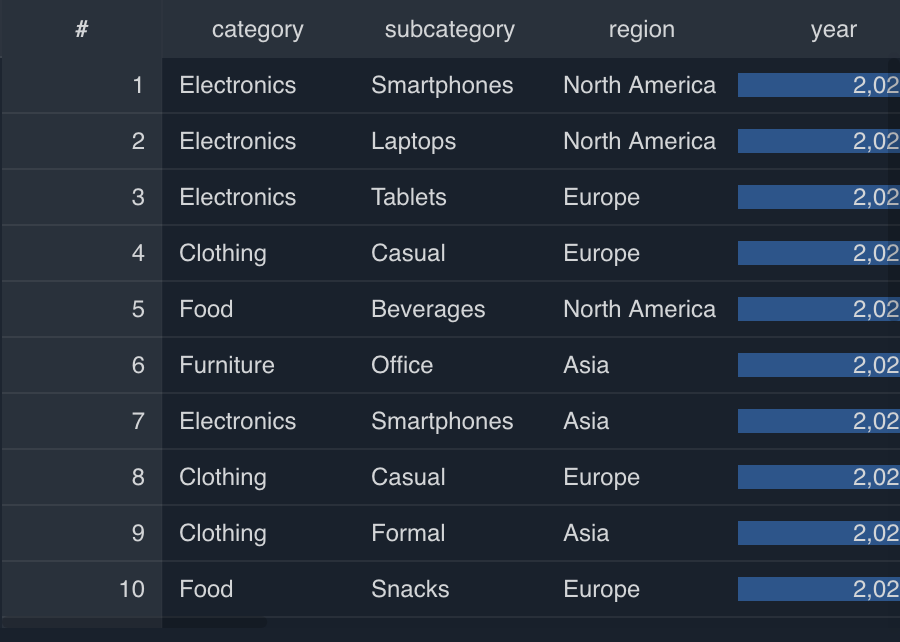
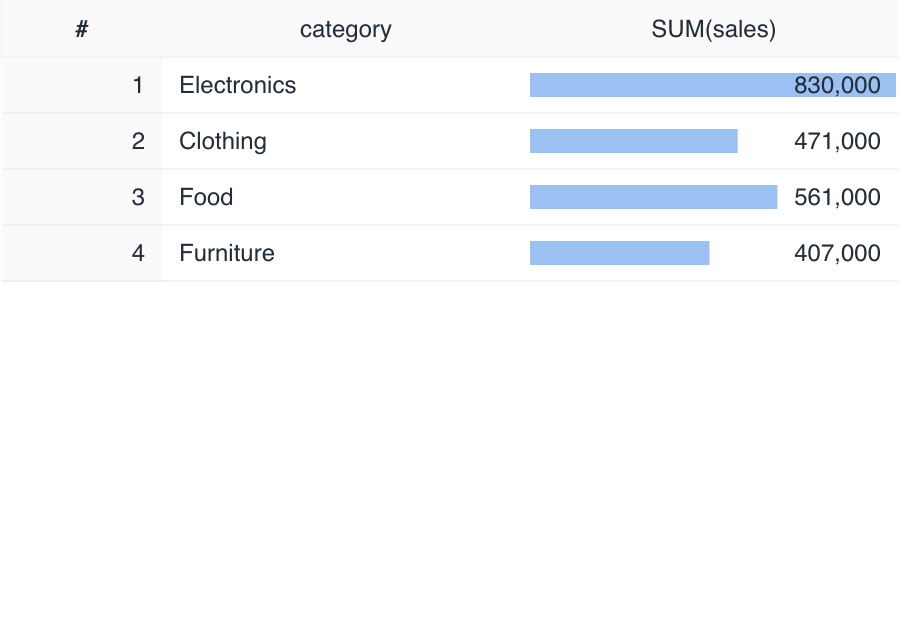
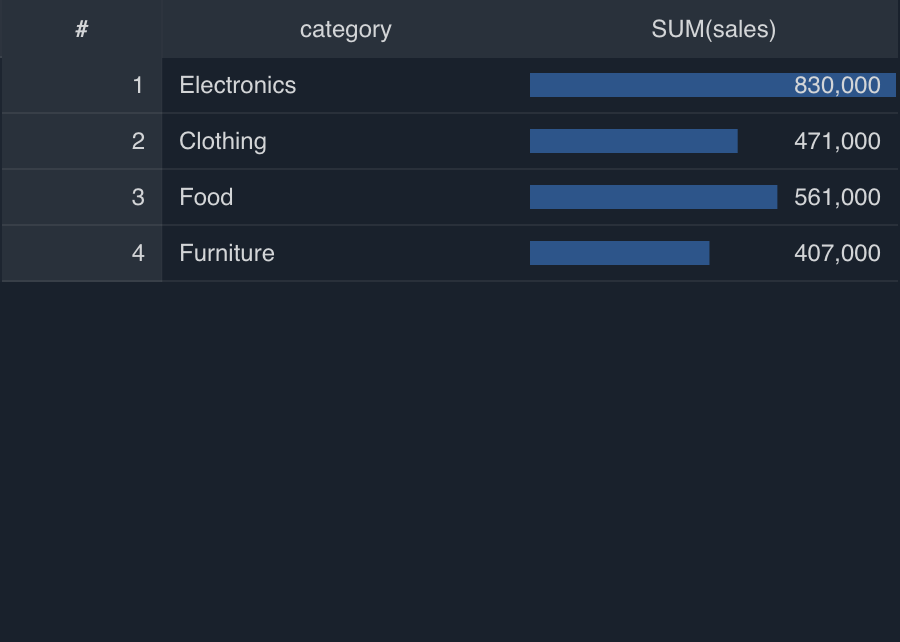
Specification
Source type
Table Chart has two source types, and the aggregation and display specification differs depending on which one you select.
| Source type | Description | Column role |
|---|---|---|
| Raw data (raw table) | Displays fetched rows as-is. | Select the columns to display. |
| Aggregated data (aggregated table) | Groups and aggregates data. | Group by (dimension), Values (metric). |
Row display
Aggregated tables initially use Flat. To change only the current display, select Aggregate > Row hierarchy above the table. This selection isn't saved in the chart settings.
- Flat: Displays aggregated results as standard rows without adding subtotals.
- Grid: Uses a separate column for each Group by field and lets you expand or collapse groups. Expanded groups don't show subtotals; collapsing a group displays its aggregate values in the parent row.
Cell detail preview
After selecting a cell or range, use the Show selection details icon on the selection to open the preview pane. A single-cell preview shows the column name, data type, and complete value. For a value cell in a pivot table, the preview shows its row axes, column axes, metric, and percentage.
For multiple cells in one row, the table view of the row details includes only the selected columns, while the JSON view includes every field in the source row. For multiple rows in one column, column statistics use only the selected values. A range that spans multiple rows and columns doesn't provide a detail preview. Select a row number to open that row's details.
Column header operations
Raw tables support the same column header operations as SQL block results. In aggregated tables, you can sort and filter from column headers, use Show column statistics, pin eligible Group by columns to the left as a group, and adjust column widths. Drag-and-drop column reordering isn't available.
Tips
Image display
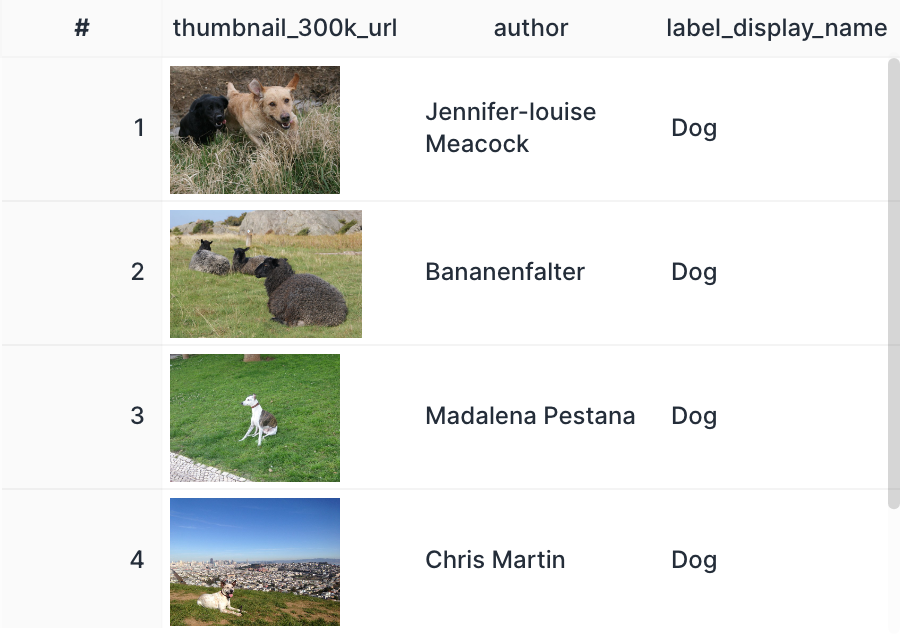
If a column's value is an image URL, you can display the image within the table chart by turning on Enable in advanced settings > Column settings > Image URL preview.

Link display
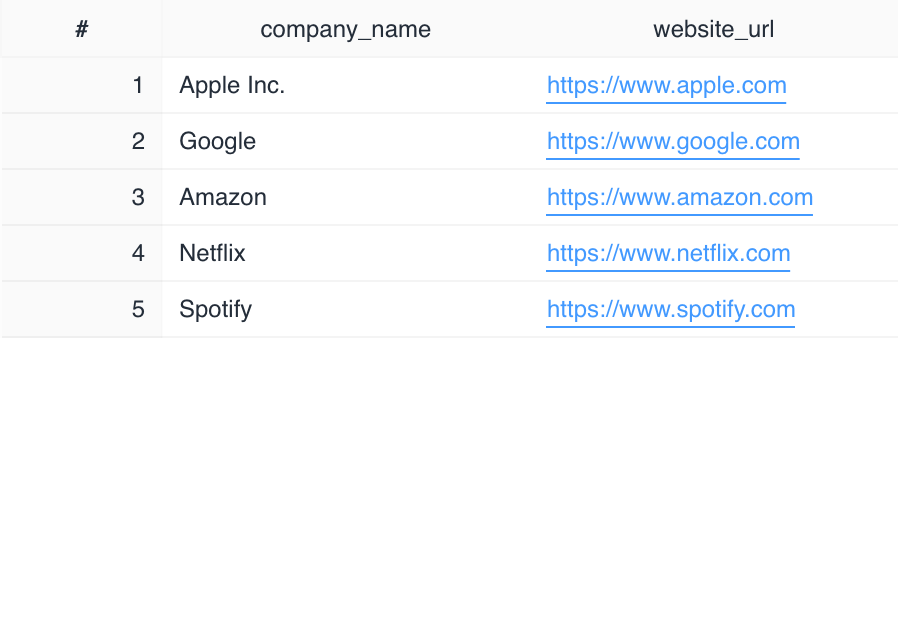
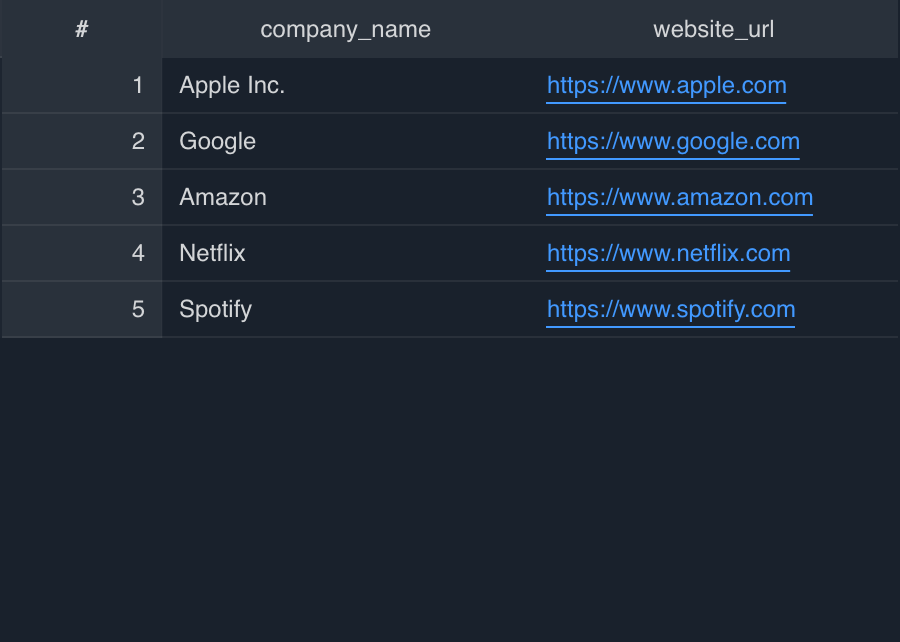
If a column's value is a URL, you can show a link in the table chart that opens the URL in a new tab by turning on advanced settings > Column settings > Enable link URL.
Creating a link to a report with parameters
By dynamically generating a URL with SQL, you can pass each row's data as a parameter to another report page.
Create the report and get the URL.
- Set a parameter on the destination report, then copy the URL from the browser's address bar.
- Example URL:
https://app.codatum.com/workspace/{workspace_id}/report/{report_id}/{page_id}
- Example URL:
- Checking the parameter ID: note the ID of the parameter widget in the report (for example:
68f369edf5e6f69036b8872d).
- Set a parameter on the destination report, then copy the URL from the browser's address bar.
Create a URL column with SQL.
Use the
CONCATfunction to generate a URL that includes each row's data as a parameter, and insert it into the chart.Example with a single parameter (country name):
sqlCONCAT( 'https://app.codatum.com/workspace/{workspace_id}/report/{report_id}/{page_id}?cdm.params.{parameter_id}=', country -- the column name to pass as the parameter ) AS link
Enable the link in the table chart.
- Open the target column under advanced settings > Column settings, and turn on Enable link URL.
Notes
- Replace
countrywith the name of the database column you want to pass as the parameter. - The current value of a parameter widget can't be referenced in SQL (only fixed values or column values).
- When a user selects a cell, the report opens in a new tab.
- For details on setting up parameters, see Specifying values from a URL.